

Updated June 2023
The Alberta Energy Regulator (AER) ensures the safe, efficient, orderly, and environmentally responsible development of hydrocarbon, geothermal, and mineral resources over their entire life cycle. As part of this mandate, we provide our stakeholders with credible information about Alberta’s energy resources that can be used for decision making. A key information resource is ST98: Alberta Energy Outlook, an annual report with independent and comprehensive information on the state of hydrocarbon reserves and the supply and demand outlook for Alberta’s diverse energy resources: crude bitumen, crude oil, natural gas, natural gas liquids1, coal, and emerging resources. Additionally, this report discusses prices and capital expenditures in the oil and gas sector, and pipelines and other infrastructure related to Alberta's resources. This year’s report includes a new section on emerging resources for lithium.
Data sets for this section are available in Excel format.
This executive summary is available in PDF format.
Report Overview
With high energy prices in 2022, the Alberta oil and gas industry continued to grow. Following an already tight energy supply in 2021, the Russian invasion of Ukraine caused oil and gas supply disruptions and underscored energy security concerns. Consequently, oil and gas prices reached multiyear highs by the middle of 2022. Despite retreating later that year, average prices grew notably in 2022. Oil and gas companies responded to higher prices by expanding production to boost revenues. With additional cash on hand, companies grew capital spending while reducing debt, buying back stocks, and increasing shareholder dividends.
The North American benchmark prices for light sweet crude oil (WTI) and natural gas (Henry Hub) and Alberta benchmark oil and gas prices (Canadian Light Sweet [CLS], Western Canadian Select [WCS] and AECO-C) all increased by at least 35 per cent in 2022.
In 2022, the price of WTI averaged US$94.23 per barrel (bbl), a 39 per cent increase from the previous year. The WTI price passed US$110/bbl in June, driven by the war in Ukraine and global demand recovery from the COVID-19 pandemic. However, the oil price declined in the second half of the year, reaching US$76.52/bbl in December, mainly due to concerns of a potential economic slowdown and limited supply disruptions with rerouted Russian oil exports. In early 2023, the oil price seemed to stabilize as slowing economic activity in developed countries and rising U.S. oil production were offset by the reopening of China’s economy and the commitment by the Organization of the Petroleum Exporting Countries and its allies (OPEC+) to a supply decrease. We expect these factors continue to influence the short-term market and forecast a WTI price of US$77.00/bbl in 2023.
Similar to the WTI price, Alberta’s average price for CLS in 2022 rose considerably to Cdn$119.72/bbl and WCS US$76.01/bbl. The price differential between WTI and CLS averaged US$2.04/bbl, and the differential between WTI and WCS prices was US$18.22/bbl. Figure 1 shows the oil price history and price differentials.
With the significant disruption to the natural gas supply in Europe, demand pressures for this commodity reshaped the trade flows globally. Consequently, the Henry Hub price for natural gas averaged US$6.52 per million British thermal units (MMBtu) in 2022, a 75 per cent increase from the previous year. With a rise in liquified natural gas (LNG) exports to Europe and increased U.S. domestic consumption, the natural gas price rose to US$8.78/MMBtu in August 2022, a 14-year high. Since then, the Henry Hub price has trended lower to US$2.44/MMBtu in February 2023 because of the shutdown of the large Freeport LNG facility in the U.S., mild winter weather, and historically high U.S. production. With relatively high inventories, the Henry Hub natural gas price forecast will average US$3.10/MMBtu in 2023.
The average annual price of AECO-C natural gas was Cdn$5.10 per gigajoule (GJ) in 2022, representing an increase of 51 per cent from 2021. The natural gas price differential between Henry Hub and AECO-C widened in 2022 because of maintenance on the Nova Gas Transmission Line during the summer.
The total production of oil and equivalent continued to set new records with favourable market prices in 2022. The production increase mainly came from nonupgraded bitumen, followed by light and medium crude oil.
Higher natural gas prices in 2022 resulted in a 7 per cent increase in marketable natural gas in Alberta, reaching the highest production level since 2010. Higher conventional (including tight) gas production drove the increase, whereas coalbed methane and shale production declined. Producers remain focused on drilling for higher-value natural gas liquids in the most productive areas of the province.
Total capital expenditures for crude oil, natural gas, oil sands, and emerging resources increased to Cdn$26.6 billion in 2022, exceeding the pre-pandemic spending in 2019. Investments in crude oil and natural gas drilling responded promptly to higher energy prices and grew by 73 per cent, reflecting a shorter return on investment. Oil sands also achieved a 15 per cent increase in 2022 from debottlenecking and optimization projects.
After completing the Enbridge Line 3 replacement in late 2021, market access was mostly sufficient for oil exports in 2022. Market access for natural gas was temporarily challenged during the summer, primarily due to high production levels and seasonal maintenance on the Nova Gas Transmission Line. The Trans Mountain pipeline expansion and Coastal GasLink pipeline will soon improve Alberta’s market access for both oil and gas.
For emerging resources, Alberta has notable hydrogen production and growth opportunities for geothermal energy, helium, and lithium. Hydrogen production is estimated to increase from 2.5 million tonnes per year in 2022 to 3.6 million tonnes per year in 2032, with an average annual growth rate of 4 per cent. Blue hydrogen production with carbon capture, utilization, and storage (CCUS) contributes to over 80 per cent of this growth. Despite small production, geothermal production will grow at an average rate of 13 per cent annually, and helium at 26 per cent annually over the forecast period.
This year’s report adds lithium to the emerging resources chapter as the AER’s mandate expanded to include minerals with the proclamation of the Mineral Resource Development Act in March 2023. Although Alberta does not currently produce lithium, several companies have announced potential projects, given the rising global demand for lithium batteries. The total production in Alberta is forecast to rise to 7.6 thousand tonnes of lithium chemical compounds by 2032.
Report Highlights
This section provides highlights of oil and gas production, prices, capital expenditures, demand, and drilling activity for 2022 and their outlook for 2023 to 2032 (the forecast period). A snapshot of the province’s reserves as of December 2022 is also provided.
Oil and Gas Production in Canada
Alberta remains Canada’s largest natural gas and oil producer (see Figure 2 and 3). In 2022, Alberta produced 62 per cent of Canada’s natural gas although British Columbia's share of marketable gas production has trended up from 27 per cent in 2013 to 36 per cent in 2022. Alberta accounted for 83 per cent of Canada’s oil and equivalent2, and 65 per cent was marketable bitumen in 2022.
Alberta’s raw crude bitumen production in 2022 was close to 3.3 million barrels per day (106 bbl/d), a 2 per cent increase from 2021.
Oil and Gas Prices
Figure 4 shows the WTI price history and forecast price ranges.
-
The price of WTI increased by 39 per cent in 2022, averaging US$94.23/bbl.
-
The price of CLS increased by 49 per cent in 2022, averaging Cdn$119.72/bbl.
-
The price of WCS increased by 38 per cent in 2022, averaging US$76.01/bbl.
-
The WTI base-price case is projected to be lower in 2023 at US$77.00/bbl. Global demand for liquid fuels is expected to decrease in 2023 due to a slowdown in global economic activity. Meanwhile, continued supply disruptions caused by the war in Ukraine are expected to support the WTI price.
-
The low-price case of US$46.92/bbl in 2023 considers global oil demand to be reduced more than expected due to global economic recession, OPEC+ production exceeding their target output level, and strong U.S. shale production growth.
-
The high-price case of US$126.37/bbl in 2023 considers both Chinese oil demand and overall global economic activity will rebound faster than projected, OPEC+ cuts more than expected to oil supply, and deteriorating geopolitical conditions disrupting further regional oil supply.
-
The WTI crude oil price is forecast to rise to US$79.00/bbl in 2024 as oil demand is expected to rebound as global economic growth resumes. The price is projected to increase moderately from 2025 onwards, reaching US$85.77 by 2032 (base-price case).
-
The differential between WTI and WCS widened in 2022 to an average of US$18.22/bbl compared with the US$13.06/bbl average in 2021; the widening of the differential was caused by releases from the U.S. Strategic Petroleum Reserve, unplanned U.S. refinery outages, and reduced demand from complex U.S. refineries.
Figure 5 shows the Henry Hub price history and forecast price ranges.
-
The Henry Hub price increased by 75 per cent, averaging US$6.52 per MMBtu in 2022. U.S. natural gas exports grew by 4 per cent in 2022, driven by LNG exports.
-
The base-price case of Henry Hub is expected to decrease to an average of US$3.10/MMBtu in 2023 amid ample supply and lower demand from power generation and industrial uses. Natural gas export capacity is limited, and natural gas prices in North America are only partially dependent on international prices. To the extent that spillover effects from Europe affect demand in North America, regional factors are the primary drivers of the price forecast.
-
In the low-price case, the price is forecast to average US$1.74/MMBtu in 2023 because North American demand is lower than expected from an economic slowdown.
-
In the high-price case, the price is forecast to average US$5.53/MMBtu in 2023 because of a stronger-than-expected economic activity supporting North American demand.
-
The Henry Hub price is forecast to rise to US$3.30/MMBtu in 2024 as U.S. demand rebounds; however, high gas inventories and production limit price gains. The price is forecast to increase from 2025 onwards, reaching US$3.91/MMBtu by 2032 (base-price case).
Capital Expenditures
Figure 6 shows the capital expenditure history and forecast for hydrocarbons and emerging resources.
- Total capital expenditures in the crude oil, natural gas, and oil sands sectors increased by 45 per cent in 2022, rising to Cdn$26.0 billion.3 The significant increase in oil and gas prices in 2022 led to a more favourable investment environment.
-
Estimated crude oil and natural gas capital expenditures increased to Cdn$16.0 billion in 2022, a 73 per cent increase from 2021, driven by increased drilling activity.
-
Estimated oil sands capital expenditures increased from Cdn$8.7 billion in 2021 to Cdn$10.0 billion in 2022, a 15 per cent increase from 2021. Debottlenecking and efficiency enhancements on various projects contributed to the increased expenditure.
-
Total oil sands, crude oil, and natural gas capital expenditures are forecast to increase to Cdn$30.4 billion in 2023, partly reflecting the AER’s price forecast. Investment is projected to grow steadily over the forecast period. By the end of the forecast period, the total capital expenditures are expected to remain relatively low compared to the 2014 peak level.
-
Capital spending for emerging resources was an estimated Cdn$0.6 billion in 2022 and is projected to increase to Cdn$0.8 billion by 2032, with some uncertainty. This spending is projected based on public announcements for hydrogen, helium, lithium, and geothermal projects and estimated capacity additions.
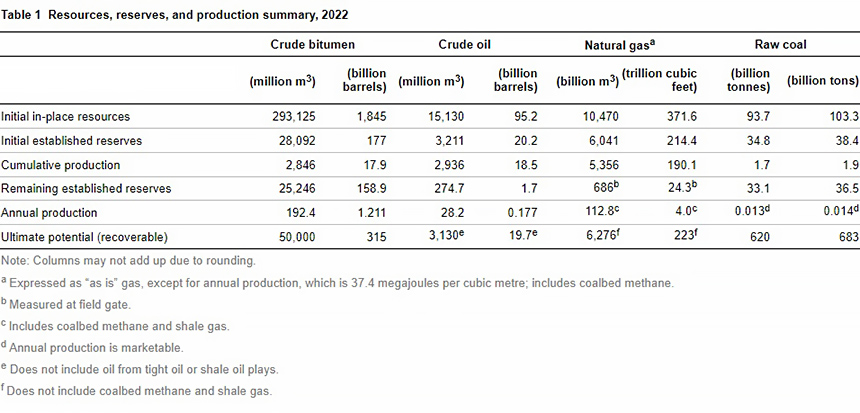
Reserves
The AER has been providing an independent appraisal of Alberta’s energy resources since 1961. The AER studies hydrocarbon extraction and ensures energy resources are being extracted in an efficient and environmentally responsible manner.
The Government of Alberta uses the information to develop policies and regional land use plans, and the energy industry uses it to evaluate investment opportunities in Alberta.
Table 1 shows the reserves determined for crude bitumen, crude oil, natural gas, and coal. The data suggests Alberta has sufficient reserves for many years of production.
Production and Demand
Figure 7 shows the primary energy production in Alberta by type.
- Total primary energy produced in Alberta increased by 7 per cent in 20224 as producers took advantage of higher commodity prices due to the war in Ukraine and supply disruptions.
-
Marketable bitumen production, which includes nonupgraded and upgraded bitumen, increased by 5 per cent in 2022 as producers responded to higher oil prices.
-
Crude oil production increased by 11 per cent in 2022 as producers took advantage of higher oil prices and placed more new wells on production.
-
Total marketable natural gas production increased by 7 per cent in 2022 due to an increase in natural gas prices. The higher production was driven by increases in conventional (including tight) gas production concentrated in Foothills Front and Northwestern Alberta.
-
In 2022, Alberta produced an estimated 14 654 petajoules (PJ) of energy from all sources or 6.6 million barrels per day of light-medium quality crude oil equivalent (106 BOE/d).
-
In 2032, Alberta is projected to produce 17 153 PJ (7.7 106 BOE/d) of energy from all sources.
-
Upgraded and nonupgraded bitumen production accounted for 51 per cent of total primary energy production in 2022.
-
In 2022, based on energy content, natural gas liquids production was about 38 per cent higher than crude oil production. This trend is expected to continue over the forecast period.
-
Total natural gas liquids production increased by 5 per cent in 2022, driven mainly by increased production of butane and pentanes plus.
Figure 8 shows the Alberta supply of crude oil and equivalent.
-
Alberta’s production of crude oil and equivalent increased by 6 per cent in 2022, reaching 3.9 106 bbl/d. The increase is primarily driven by nonupgraded bitumen and crude oil supply increases.
-
Crude oil and equivalent production are expected to grow throughout the forecast period, reaching 4.8 106 bbl/d by 2032, primarily driven by increased upgraded and nonupgraded bitumen production.
-
Crude oil production increased in 2022 to 0.5 106 bbl/d and is projected to continue growing until 2025. However, from 2026 to 2032, it will gradually decline as new wells placed on production do not offset the decline in existing production.
-
Production of pentanes plus is forecast to grow from 0.4 106 bbl/d in 2022 to 0.5 106 bbl/d by 2032.
Figure 9 shows the percentage of bitumen upgraded in Alberta.
- In 2022, an estimated 41 per cent of produced raw bitumen was upgraded in Alberta. By 2032, only about 37 per cent of raw bitumen is projected to be upgraded in Alberta as the growth in raw bitumen production is expected to outpace upgrading capacity additions.
- Upgraded bitumen output for 2022 decreased marginally by 0.6 per cent, as the production increases in Syncrude and Suncor upgraders were offset by decreases in other upgraders.
Figure 10 shows the primary energy demand in Alberta by type.
-
Total primary energy demand within the province increased by 6 per cent to 5846 PJ (2.6 106 BOE/d) in 2022. Alberta demand is projected to increase to about 6697 PJ (3.0 106 BOE/d) by 2032. The largest increase is attributed to strengthening demand for pentanes plus as a diluent in bitumen blending. Increasing demand for natural gas will come from power generation and oil sands in situ operations.
-
Federal and provincial government policies targeting the reduction of carbon dioxide emissions will drive the demand for coal in Alberta to zero, as the remaining coal-fired power plant will be phased out in 2023.
Figure 11 shows the primary energy removal of energy types from Alberta.
-
Primary energy removals from Alberta increased by 7 per cent in 2022. Higher production output due to high commodity prices enabled increased energy removals.
-
Total primary energy removals from the province in 2022 were estimated at 10 686 PJ (4.8 106 BOE/d), with oil (bitumen and crude oil) and natural gas liquids representing 83 per cent of primary energy removals for the year.
-
Removals from the province are projected to reach 13 061 PJ (5.9 106 BOE/d) by 2032, with bitumen representing a growing share of primary energy removals.
-
Natural gas removals from Alberta are projected to grow moderately over the forecast period as production growth is forecast to outpace increases in domestic demand. The removal growth also supports the rise in nondomestic demand for natural gas as a transition fuel.
-
Removals of marketable bituminous coal from Alberta increased by 64 per cent in 2022 as production increased at the Vista coal mine, and operations resumed in 2021 at the Coal Valley and Grande Cache mines after they were temporarily closed and suspended due to the pandemic in 2020.
Figure 12 shows the removal of oil from Alberta by type.
-
In 2022, removals of crude oil, pentanes plus, upgraded bitumen, and nonupgraded bitumen were estimated at 590.4 thousand cubic metres per day (103 m3/d) or 3.7 106 bbl/d—about 6 per cent higher than in 2021.
-
By 2032, about 743.8 103 m3/d (4.7 106 bbl/d) of crude oil, pentanes plus, upgraded bitumen, and nonupgraded bitumen are forecast for removal from the province. This projection assumes that most of these removals go to the U.S., and there will be sufficient transportation capacity (pipeline and rail) to ship these volumes.
Drilling Activity
Figure 13 shows that total drilling increased by 52 per cent in 2022 (natural gas drilling increased by 17 per cent, crude oil drilling increased by 39 per cent, and oil sands drilling increased by 86 per cent). This increase is attributed to strong growth in energy prices. Last year’s drilling activity was the highest during the past eight years.
1 Natural gas liquids include ethane, propane, butane, and pentanes plus—on their own or combined—obtained from processing raw gas or condensate.
2 Oil and equivalent comprises light, medium, heavy, and ultra-heavy crude oil; upgraded and nonupgraded bitumen (referred to as marketable bitumen); and condensate (pentanes plus).
3 Historical data on oil sands, crude oil, and natural gas are from the Canadian Association of Petroleum Producers (CAPP) Statistical Handbook (2022 data). Capital expenditures for 2022 are estimates from CAPP.
4 Trends and growth rates may differ slightly when standard units of measure, such as cubic metres or tonnes, are compared. Various grades of energy commodities have different heating values, and any changes to their composition may yield slightly different numerical trends and growth rates.